Here’s the Chinese version:
In this article, I will discuss how I successfully debugged some RTX code using Cursor.
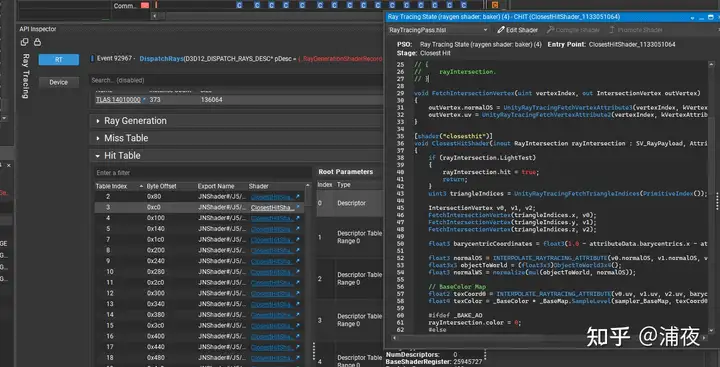
Debugging DX12 RTX code can be quite challenging. While Renderdoc is a tool we are familiar with, it does not support RTX. We typically use Nsight or PIX, but their debugging capabilities are limited. We can only view information such as acceleration structure and hit table, and cannot debug step by step. (If you know of a way to do this, please let me know!)
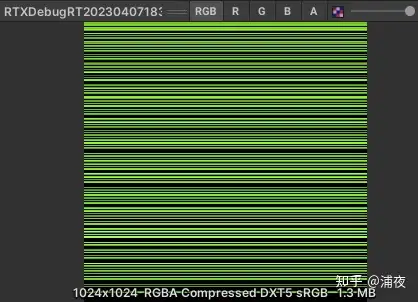
What can you do if you want to debug the details? You can output information such as the intersection results of the light rays, positions, and normals to a texture for debugging:
However, this method is still not very intuitive. While I can see what the RTX result looks like on the texture, it’s difficult to determine the specific value of the light rays in a particular direction. Currently, I can only rely on logs, but using logs for output is even more unintuitive and it can be challenging to locate the correct log among a large number of logs.
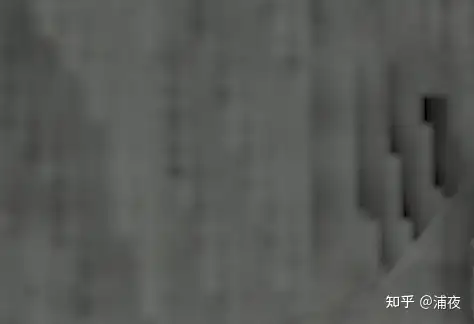
For instance, I encountered a bug where the RTX result appeared mosaic on a flat stone.
In summary, the RTX accumulation result at certain positions is not continuous. Why is this happening?
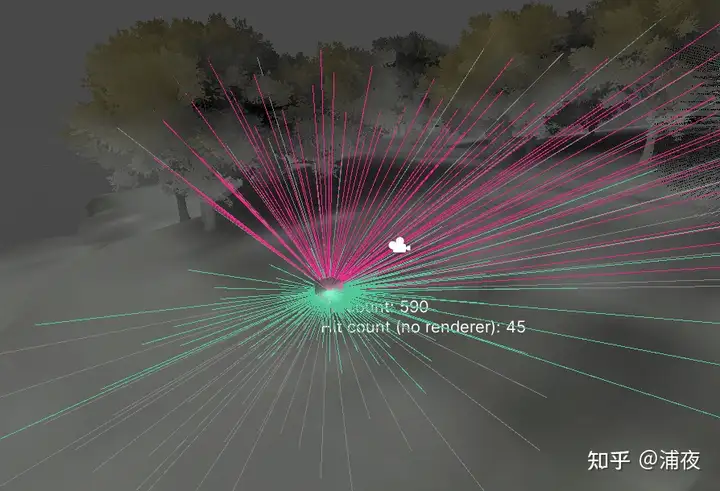
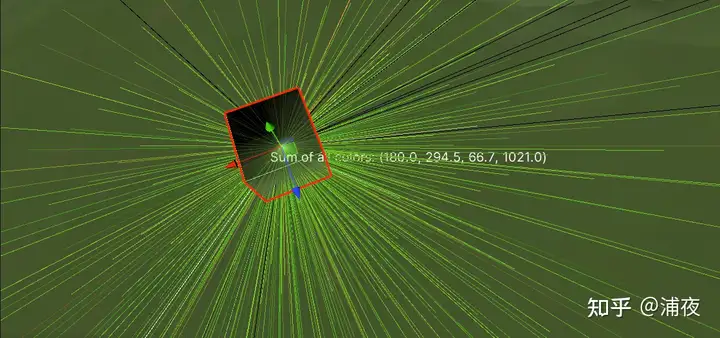
What can we do? Why not let GPT help us write a debugging tool! For example, a tool like this:
In fact, this tool has gone through many iterations. I am like a product manager holding a small whip and constantly changing requirements, and GPT is like a hardworking programmer who is willing to do anything, and doesn’t even ask me to sign a contract (laughs).
Me: Draw all the rays in every direction!
GPT: Done.
Me: It’s too messy, let’s not draw the rays that didn’t hit anything!
GPT: Done. (Used Raycast.hit to determine and help you clip the rays)
Me: Add the number of hits for each ray!
GPT: Done. (Displayed it using 3D UI)
Me: Use different colors to distinguish between different materials that were hit, and count them separately!
GPT: Done. (Used a dictionary to map materials to colors)
Me: I can’t see anything. Just read back the RTX result and display it on the ray color!
GPT: Done.
Me: The display is correct, but I can’t see where the bug is. Display the accumulated color results too!
GPT: Done.
Me: Distinguishing colors by material is useless, let’s delete it.
GPT: Done.
Me: Counting the number of ray hits is useless, let’s delete it.
GPT: Done.
Me: Oh, by the way, add a snap function to snap to the integer point I need to debug!
GPT: Done.
Me: Don’t write the tool too poorly, remember to clean up the garbage collection.
GPT: Done.
Perfect!
This tool is like having a metal detector, allowing you to easily detect the source of the problem.
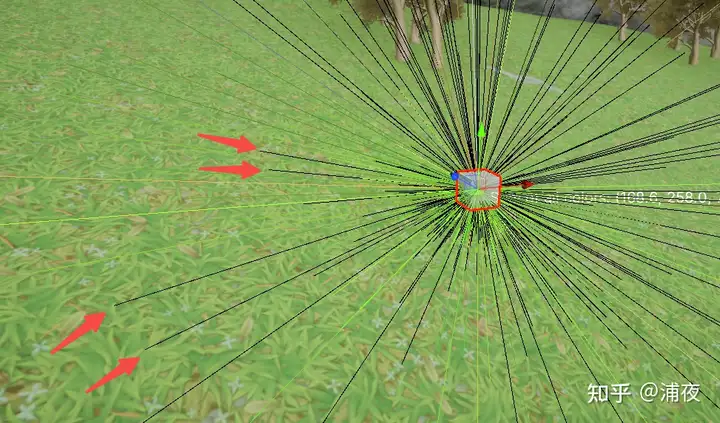
After completing this tool, the color of each ray in every direction represents the color of the indirect light coming from that direction. When I used the metal detector in the area where the mosaic appeared, I found that some directions should be able to receive indirect light normally, but the rays are displayed as black?
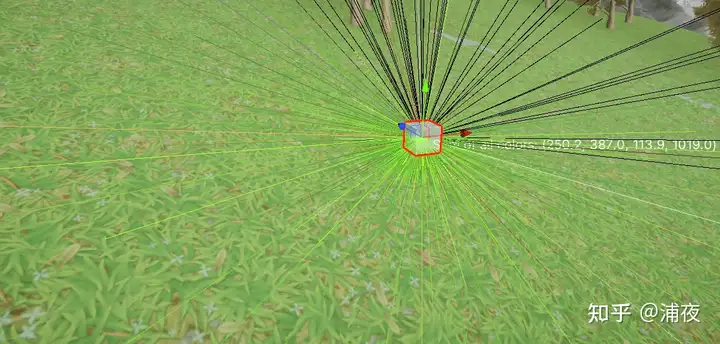
After modifying the RTX result displayed by the rays to return the texture color instead of the light color, all the colors appeared normal. Therefore, the issue must be with the second reflection calculation! Additionally, rays that are more parallel to the ground are less likely to have problems. Could it be because the second reflection cannot penetrate and hit the ground itself?
After considering this feature, I attempted to solve the problem by modifying the rayDescriptor.TMin to a larger value, and it worked!
This time, using AI to write code is not just a gimmick. It’s truly productive now.


Comments powered by Disqus.